Analytics and Reporting
CharmHealth supports a robust Analytics and Reporting framework, using which you can generate various types of reports by mining the data. To perform analytics, click on the 'Analytics' icon from the Home dashboard
- Practice Statistics
- Appointment Reports
- Patient by Registration
- Patient Statistics
- Patients By Primary Care Physician
- Patients By Referring Provider
- Patients By In-house Care Team
- Patient Followup
- Recall Report
- Patient Insurance Report
- Vaccinations
- Diagnoses
- Prescriptions
- Lab Tests
- PHR Usage
- Meaningful Use Report (Medicaid)
- MIPS ACI Report (Medicare)
- Clinical Quality Measures Report (CQM)
- Feedback Report
- Flowsheet Report
Practice Statistics
By default, when you choose the 'Analytics' section, the 'Encounter Statistics' report will be shown. From this report, you can check the statistics of all the Encounters created in your Practice. This report can be filtered by Facility, Provider, and Period of the year. It acts as a health report for your Practice and shows your Practice performance. You can also generate reports based on Encounters by Month/Day, Visit Type, Mode, and Provider.

Appointment Reports
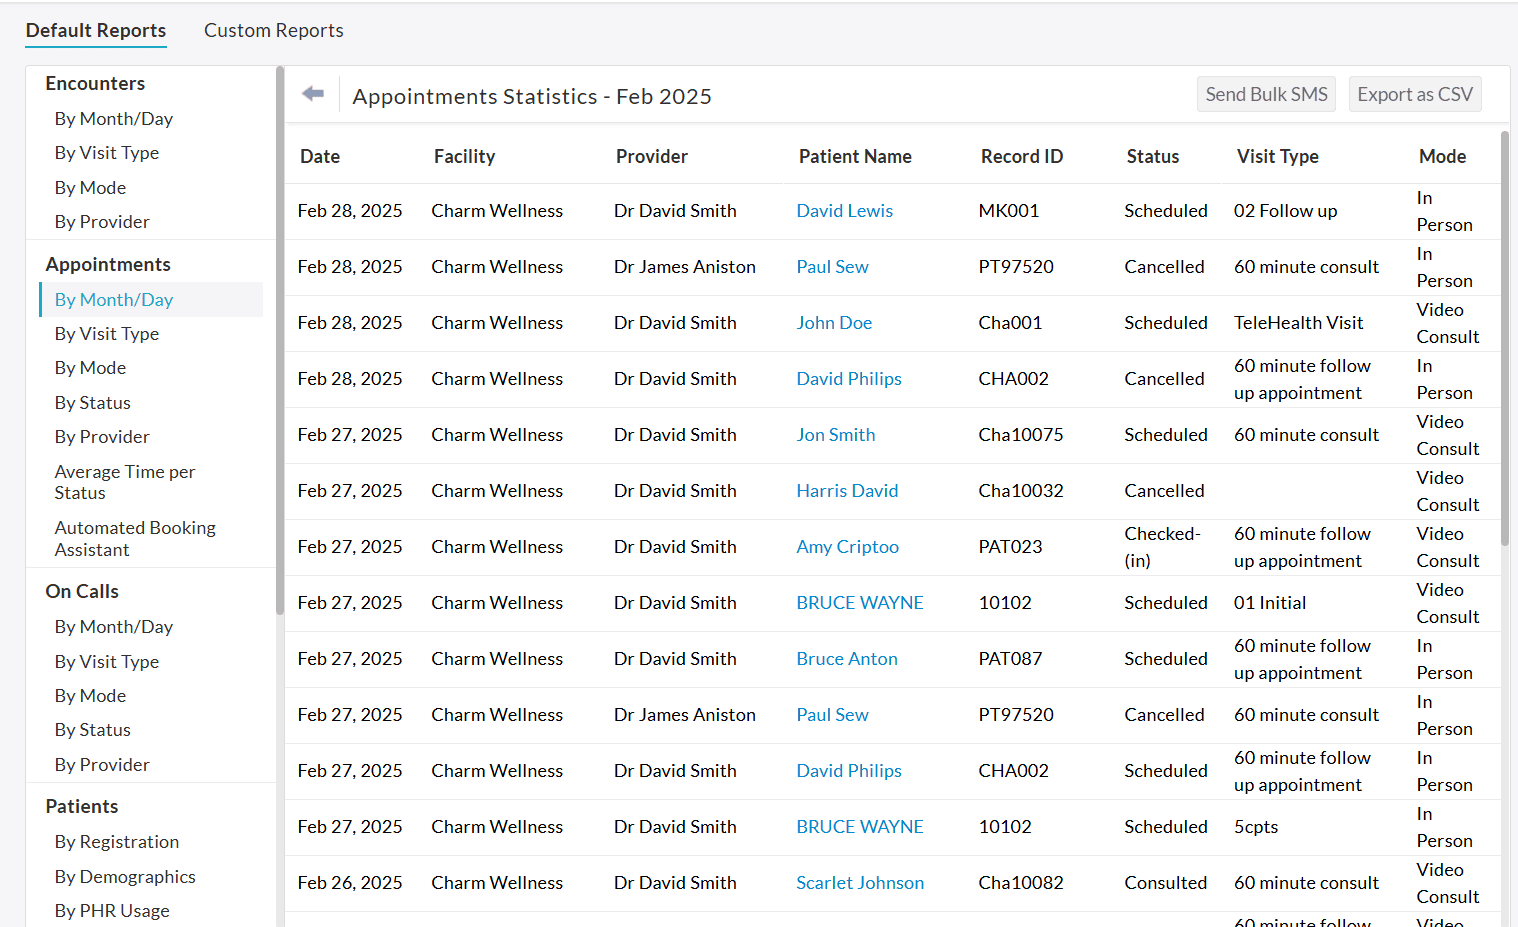
Practices can view the Appointment Reports in the 'Analytics' section to gain insights into appointment trends and make decisions more efficiently.
The Practice members with the necessary role privilege can view the Appointment reports under the 'Analytics > Default Reports > Appointments' section.
The report provides a detailed summary of appointments based on Month/Day, Visit Type, Mode, Status, Provider, Average Time per Status, and Automated Booking Assistant.

You can click on the graph section to view the details and export the data as a CSV file.

Patient by Registration
The Patient by Registration report shows the number of new Patients who have come to the Consultation. This report can be filtered by Facility Name and Period.

Patient Statistics
With the help of the 'Patient Statistics' report under the 'Custom Reports' section, you can generate various types of reports about the Patients treated in the Practice. The reports can be generated based on the demographics of the Patient and Medical History that includes Diagnosis, Medication, etc. You can also pull out the reports based on the Provider and Appointment History.
The report can also be generated for the Patients with Card on File and Recurring profiles using the 'Card on File & Recurring Profile Information' filter options.

Patients By Primary Care Physician
With the help of the 'Patients by Primary Care Physician' report, you will be able to look at the statistics of Patients associated with the Primary Care Physician. You can also generate reports based on the registered Patients in a given period.

Patients By Referring Provider
The statistics of Patients related to the Referring Provider will be listed in the 'Patients By Referring Provider' report.

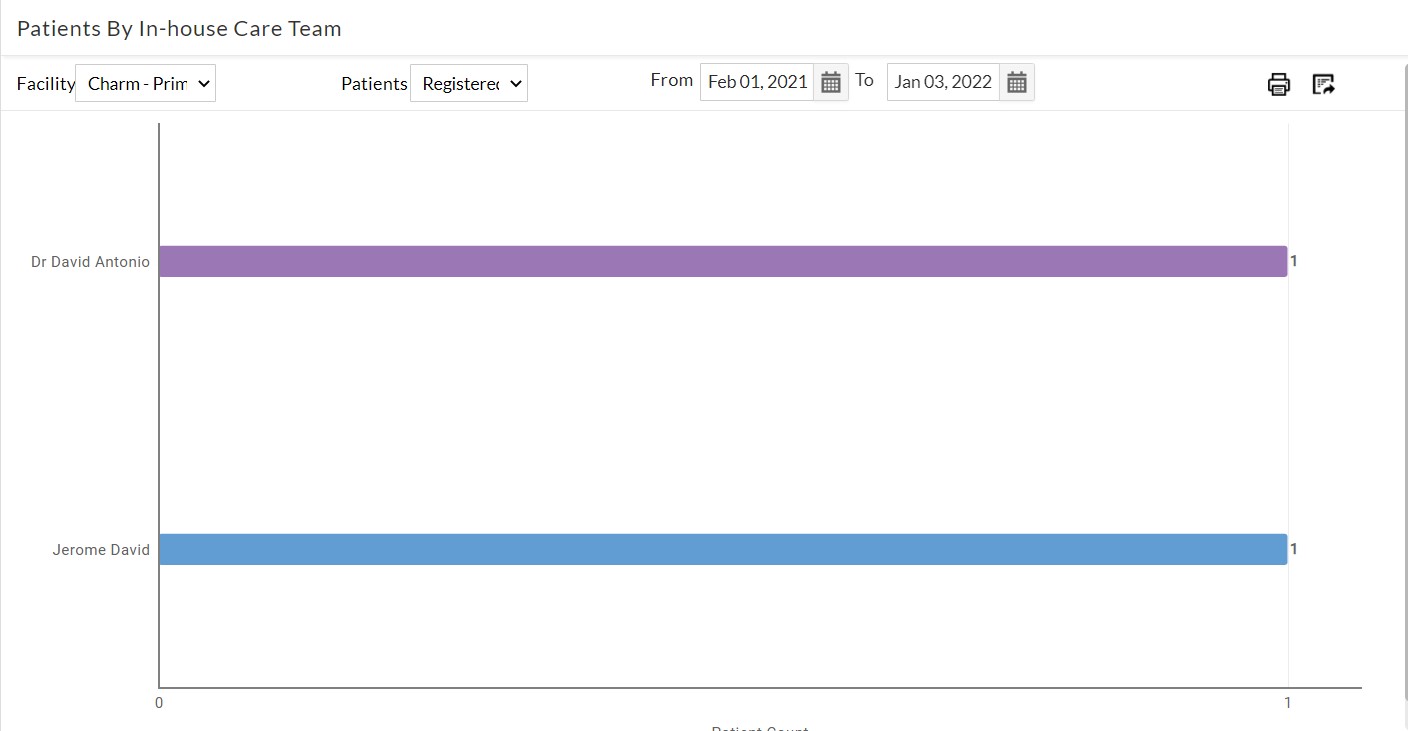
Patients By In-house Care Team
This report shows a list of all the Patients associated with the In-house Care Team. You can also generate reports based on the registered Patients.

Patient Followup
This report will be helpful to check which Patients have not visited your Practice in a given period. This report lists the Patients seen by the selected Provider and who have not visited again for the past 'n' number of months.


Recall Report
This report shows the list of Patients who need to be recalled for follow-up appointments, where the due date falls between the given period. You can filter the report based on Recall Type, Recall Status, Provider, etc.

Patient Insurance Report
- The Patient Insurance Report under the 'Analytics > Custom Reports' section contains details about the Patient's Insurance Policy.
- This report has an option to search by Patient name.
- Choose the Insurance Category and other necessary details to generate the report.
- On generating the report, you can export the data as a CSV file by clicking the 'Export as CSV' button.

Vaccinations
This report shows the list of Patients who have received Vaccinations during the selected period.

Diagnoses
This report mines data across the Practice and provides data on the number of Patients diagnosed by a specific diagnosis type. Clicking on each row will show the underlying data with the list of Patients diagnosed. This report provides a list of Top 20 Diagnosis in your Practice.


Prescriptions
This report examines data across the Practice and provides data on the number of Patients treated with a particular drug. Clicking on each row will show the underlying data with the list of Patients who had been prescribed the selected Medication. This report provides a list of Top 20 Prescriptions in your Practice.

Lab Tests
With this report, you can know the average value of the selected Lab Tests across your Practice. This report provides a list of Top 20 Lab Tests in your Practice.

PHR Usage
The 'PHR Usage' report shows the number of Patients who were given access to the Patient Portal. On clicking the particular segment on the Pie Chart, you can see the list of Patients. From the 'Patients without PHR' list, you can send the PHR invitation to new Patients.

Meaningful Use Report (Medicaid)
Meaningful Use Report is used for the Medicaid incentive program. Follow the steps below to generate a MU Report.
- Go to the 'Analytics > Custom Reports > Meaningful Use Report' section.
- Select the Provider.
- Choose the Stage of Submission - 'Modified Stage 2' or 'Stage 3'
- Enter the Reporting Period.
- Click on the ‘Request’ button

MIPS ACI Report (Medicare)
MIPS ACI Report is used for the Medicare incentive program. Follow the steps below to generate a MIPS ACI Report.
- Go to the 'Analytics > Custom Reports > MIPS ACI Report' section
- Choose the Stage of Submission - ‘ACI Transition’ or ‘ACI’
- Select the Submission Type (Individual or Group)
- Select the Facility and Provider
- Enter the reporting period
- Click on the ‘Request’ button

MIPS Eligible Clinicians may participate in MIPS individually or as a group.
Participate as an individual:
MIPS Eligible Clinicians participating as individuals will have their payment adjustment based on their performance. An individual is a single Clinician, identified by a single National Provider Identifier (NPI) number tied to a Taxpayer Identification Number (TIN) with two or more eligible Clinicians (including at least 1 MIPS eligible Clinician) as identified by their National Provider Identifiers (NPI), who have reassigned their Medicare billing rights to the TIN.
Participate as a group:
MIPS Eligible Clinicians participating in MIPS with a group will receive a payment adjustment based on the group's performance. Under MIPS, a group is a single Taxpayer Identification Number (TIN) with two or more eligible Clinicians (including at least 1 MIPS eligible Clinician) as identified by their National Provider Identifiers (NPI), who have reassigned their Medicare billing rights to the TIN.
Clinical Quality Measures Report (CQM)
Select the 'CQM report for MIPS/MU submission' option from the 'Settings > Analytics > CQM Measures' section. Generate the report by selecting the Provider and Reporting Period.
The report will be generated during night hours, and you can view it once it is generated.

Feedback Report
Feedback provided by individual Patients gets listed along with the other Questionnaires under the 'Patient Dashboard > Patient Details > Questionnaires' section.
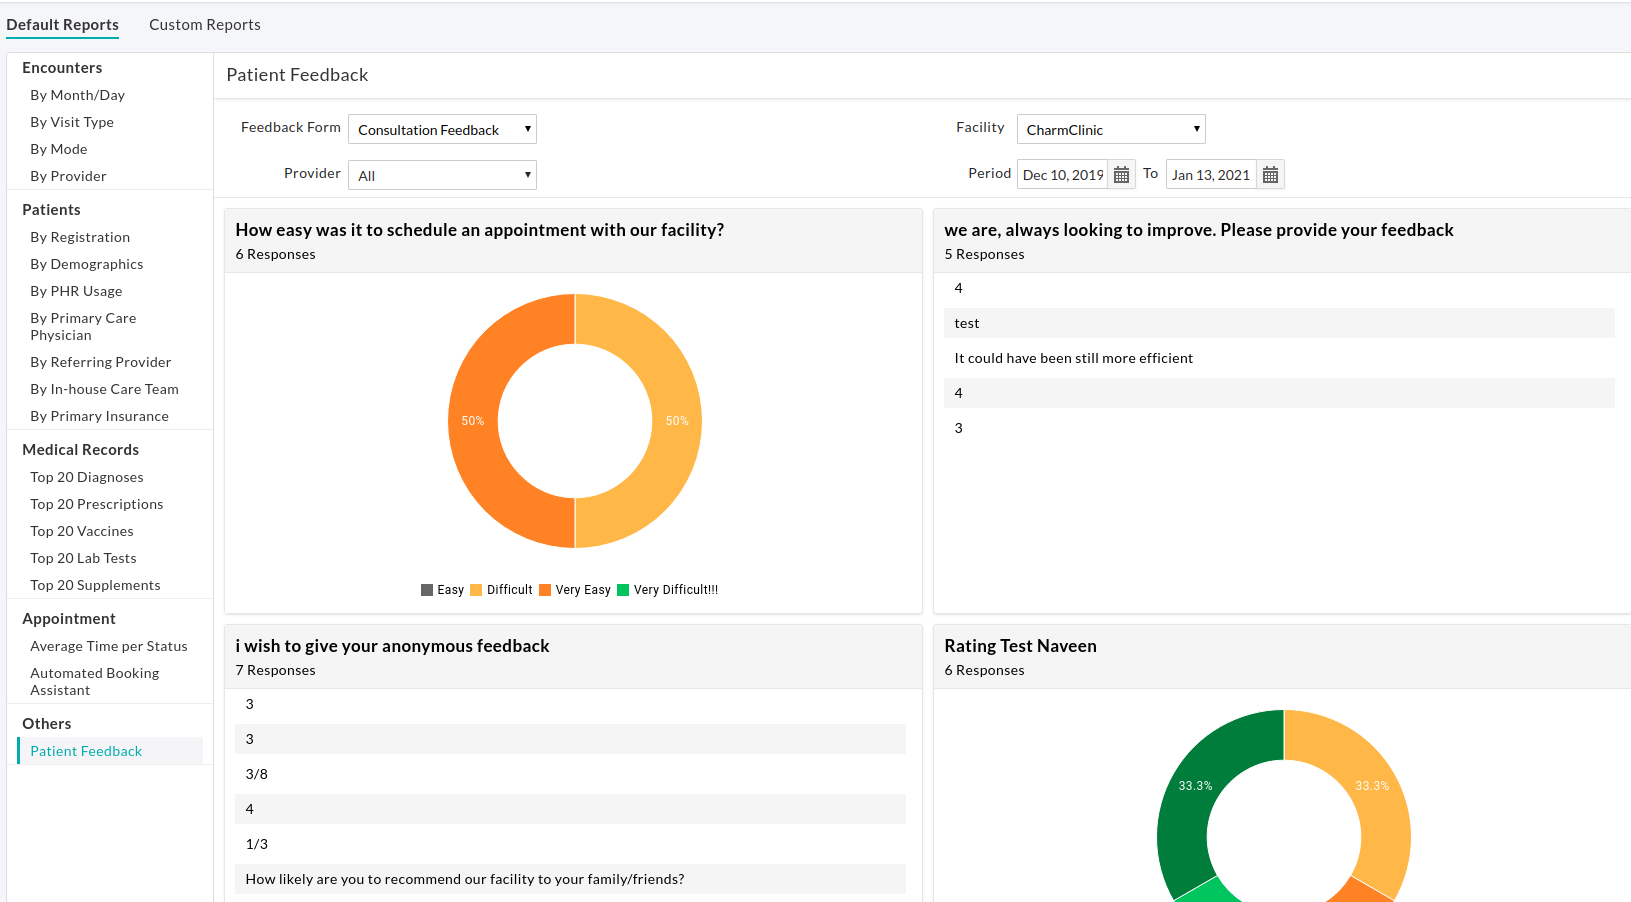
You can also get an insight into the feedback across Patients from the 'Analytics > Custom Reports > Patient Feedback' section.

Choose a Feedback Form, Provider, Period, and Facility. Then click on the 'Generate' button.
Patient Feedback gets aggregated and shown as an easily understandable graphical view from the 'Analytics > Default Reports > Others > Patient Feedback' section.

You can click on the graph section to view the details and export the data as a CSV file.
Flowsheet Report
Reports can be generated based on the Flowsheet Entries' that are entered by Patients or fetched from the questionnaires. You can choose the required Flowsheet, enter the date range, and choose all or flagged entries to generate the report.

Data filled during the given period are shown in a tabular view with an option to export as a CSV file.
